


The U.S. Ad Market is Flattening —An Analysis of the Rest of The Ad Industry
OOH in the Lead For Q2 Percentage Growth

We reported the OAAA’s announcement that Out of home (OOH) advertising revenue increased 40.5 percent in the first quarter of 2022 compared to the previous year, accounting for $1.8 billion. Many of you asked us how that compares with the rest of the advertising industry.
Here’s an analysis of the rest of the ad industry from Standard Media Index, which captures actual invoicing data from all major holding companies and most major independents, representing 95% of national brand ad spend.
Standard Media Index Core Release
May 2022
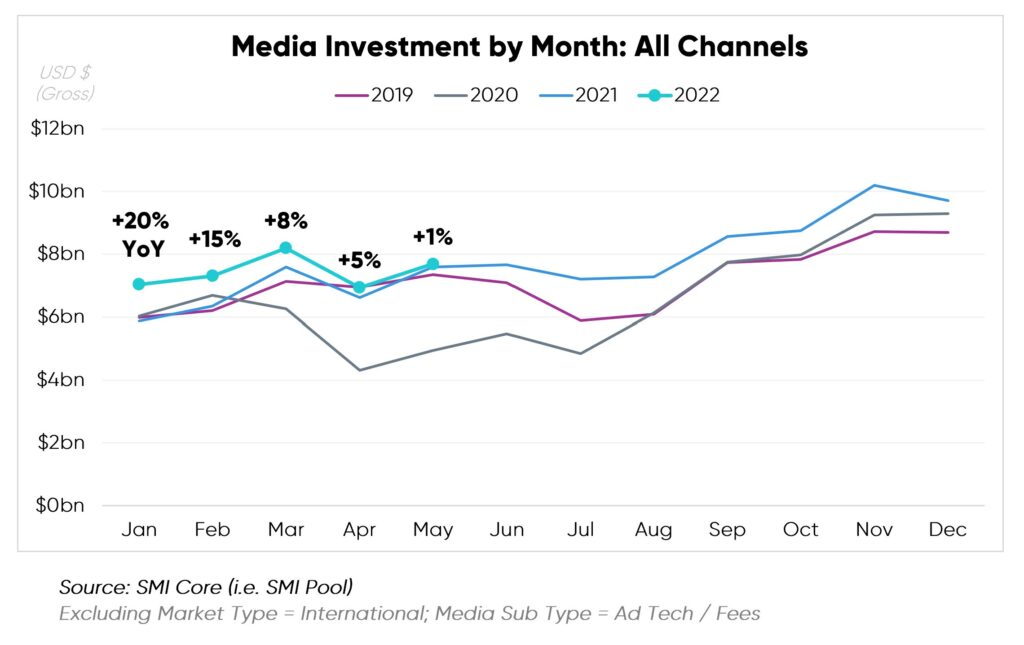
May 2022 spending was relatively flat year-over-year with a modest amount of growth. However, it was the second-highest spend month during year-to-date 2022 and the best May on record (per SMI Core data, back to 2017).
Q2 2022 (Apr – May)
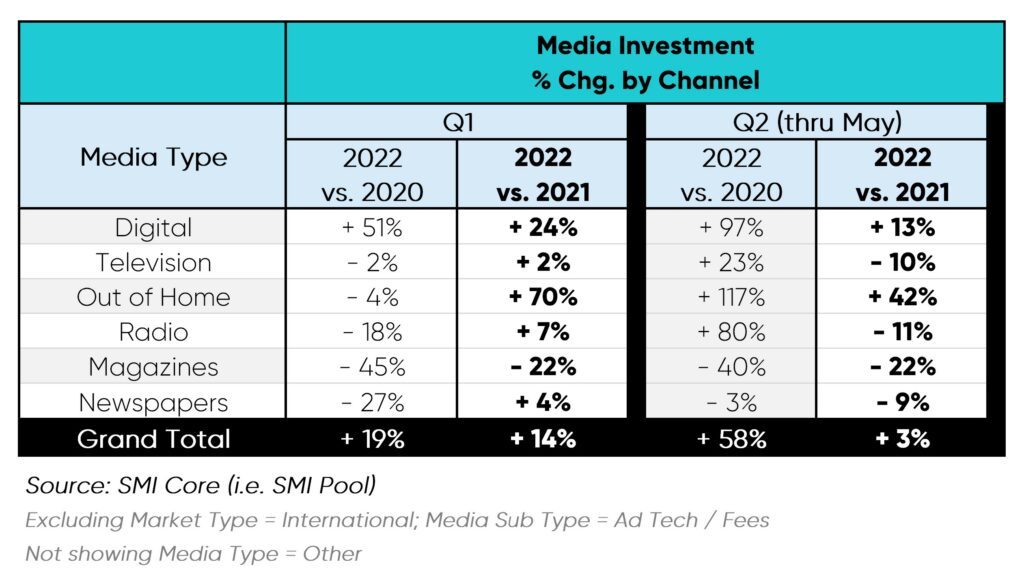
Digital and Out-of-Home continued to post the largest percent spend increase vs. 2021.
Upward Digital momentum continued, with online channels representing a 56% share of dollars, after newly surpassing Television in the same period last year. (i.e., Apr – May 2021)
Linear TV spend receded in Q2 to date, as gains in the Sports Genre (+15%), primarily NBA and NHL, failed to balance out the pull-back across Entertainment (-14%) and News (-4%).
OOH had the greatest percentage growth in the quarter thus far. Year-over-year, Entertainment & Media (+55%) and Pharma (+66%) sectors primarily drove growth in ad revenue for Out-of-Home media.
Insights by Media Owner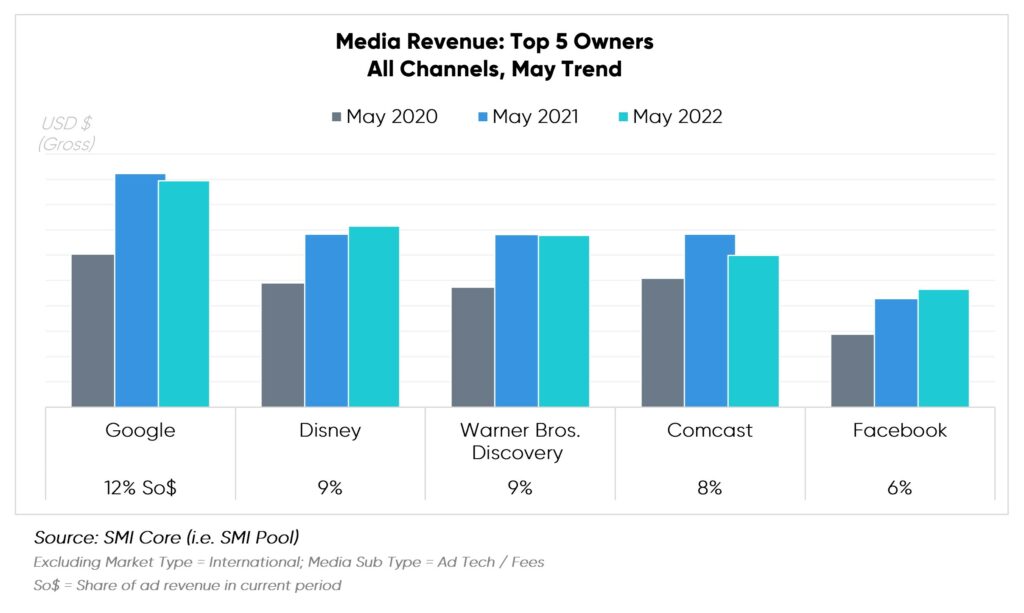
Only Facebook and Disney sustained ad spend gains into May 2022 vs. 2021, amplifying last year’s Covid-19 recovery trajectory.
Facebook reached a new high for the month, +8% vs. 2021 and +61% vs. 2020. Banking & Investments marketers were prime investors in Facebook. Notably, Online Retailers (+142%) and Toys & Games (+133%) marketers ramped up advertising, more than doubling their investment in May 2022.
Disney ad revenue grew +5% vs. March 2022 and +46% vs. March 2020. Disney was the only top-five Traditional Media Owner to display increased spending in the Linear space (+8%). Prescription Drugs showed the heftiest investment, while the Credit Cards sector notably expanded +156% over the previous year.
Warner Bros. Discovery Digital ad revenue rose +46% vs. 2021, counteracting Linear declines (-5%) but not enough to tip the scale toward overall growth. Prescription Drugs and Automotive Vehicles & Dealerships led the pack among investors, while Credit Cards (+93%) and Banking & Investment spend rose significantly.
Insights by Product Category Group
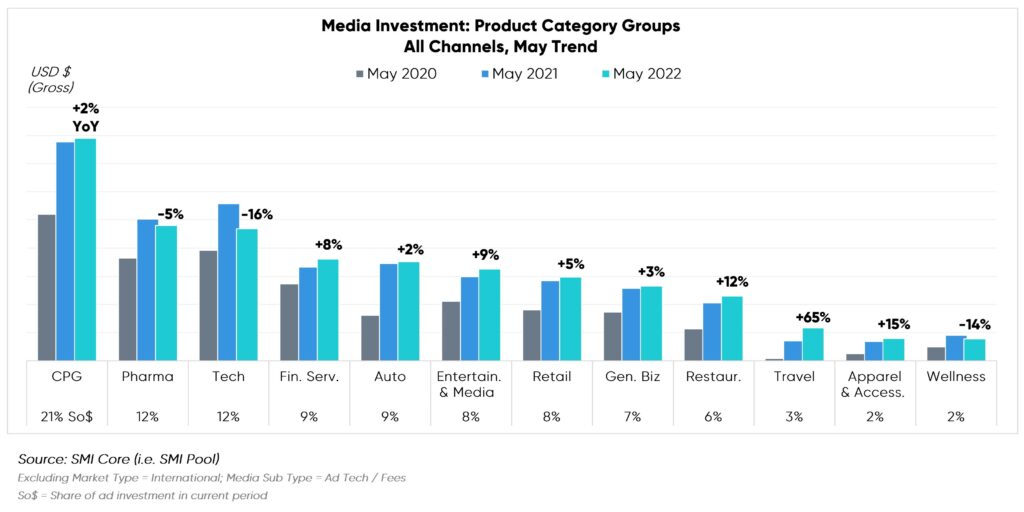
CPG, Pharma and Technology remained the top three categories, tracking back to March 2020. Prescription Drugs, -7%, drove year-over-year declines in Pharma, while Tech receded across all subcategories.
Travel and Apparel & Accessories attained the strongest percentage growth vs. May 2021. As we continually return to pre-pandemic activities and summer travel arrives, we see Hotel & Casino Resort (+97%) double and Cruise Lines (+276%) triple investments. Meanwhile, Clothes & Apparel (+ 41%) and Jewelry & Watches (+19%) propelled Apparel & Accessories at large.
Entertainment & Media continued to grow (+9%) vs. May 2021. Pre-recorded Content rose by nearly +$100MM, by far the strongest volume increase year-over-year within the sector. Spectator Sports, Concerts, & Live Entertainment also had ample lift, +36% over the previous year.
[And while you’re at it, revisit Geopath’s 2021 Full-Year OOH Spending Report]


- Advertisement -

[…] 5. The U.S. Ad Market is Flattening — An Analysis of the Rest of The Ad Industry […]