

OUTFRONT Media Reports Third Quarter 2023 Results
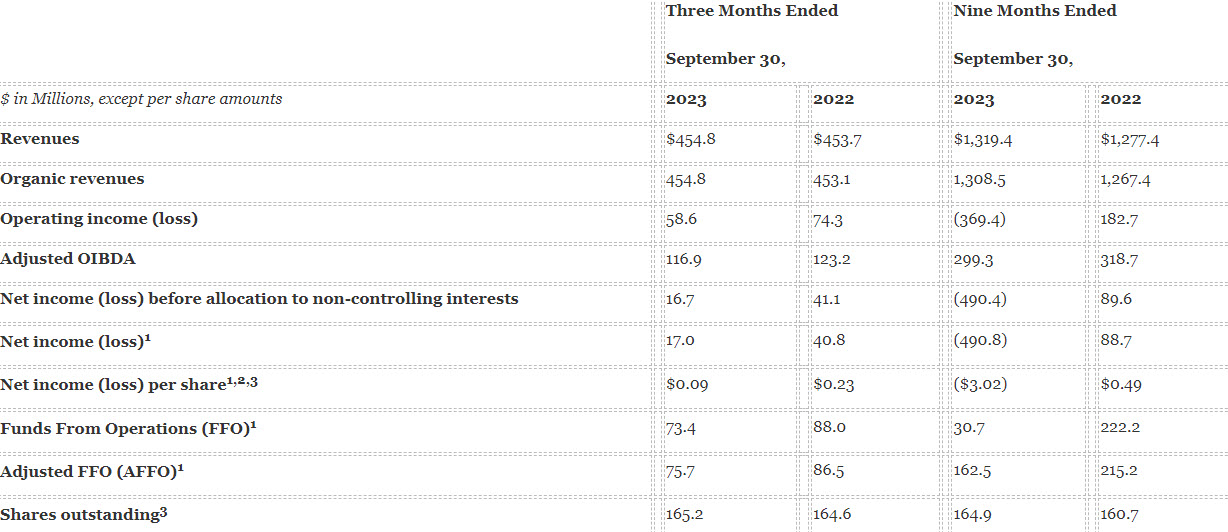
Revenues of $454.8 million
Operating income of $58.6 million
Net income attributable to OUTFRONT Media Inc. of $17.0 million
Adjusted OIBDA of $116.9 million
AFFO attributable to OUTFRONT Media Inc. of $75.7 million
Quarterly dividend of $0.30 per share, payable December 29, 2023
NEW YORK, — OUTFRONT Media Inc. (NYSE: OUT) today reported results for the quarter ended September 30, 2023.
“As expected, third quarter revenues were up slightly as a result of higher billboard revenues and strength in our local business,” said Jeremy Male, Chairman and Chief Executive Officer of OUTFRONT Media. “We were also pleased to recently announce an agreement for the strategic sale of our Canadian business to Bell Media, which will provide us with additional financial flexibility as we move towards 2024.”
“As expected, third quarter revenues were up slightly as a result of higher billboard revenues and strength in our local business,”
Notes: See exhibits for reconciliations of non-GAAP financial measures; 1) References to “Net income (loss)”, “Net income (loss) per share”, “FFO” and “AFFO” mean “Net income (loss) attributable to OUTFRONT Media Inc.”, “Net income (loss) attributable to OUTFRONT Media Inc. per common share”, “FFO attributable to OUTFRONT Media Inc.” and “AFFO attributable to OUTFRONT Media Inc.,” respectively; 2) References to “per share” mean per common share for diluted earnings per weighted average share; 3) Diluted weighted average shares outstanding.

Third Quarter 2023 Results
Consolidated
Reported revenues of $454.8 million increased $1.1 million, or 0.2%, for the third quarter of 2023 as compared to the same prior-year period. Organic revenues of $454.8 million increased $1.7 million, or 0.4%.
Reported billboard revenues of $363.6 million increased $8.6 million, or 2.4%, due primarily to an increase in average revenue per display (yield), and the impact of new and lost billboards in the period, including acquisitions. Organic billboard revenues of $363.6 million increased $9.1 million, or 2.6%.
Reported transit and other revenues of $91.2 million decreased $7.5 million, or 7.6%, due primarily to a decrease in average revenue per display (yield), partially offset by the impact of a new transit franchise contract. Organic transit and other revenues of $91.2 million decreased $7.4 million, or 7.5%.
Total operating expenses of $239.8 million increased $7.2 million, or 3.1%, due primarily to higher billboard property lease expenses and higher guaranteed minimum annual payments to the New York Metropolitan Transportation Authority (the “MTA”), partially offset by a decline in non-MTA transit franchise costs. Selling, General and Administrative expenses (“SG&A”) of $105.3 million decreased $1.2 million, or 1.1%, primarily due to lower compensation-related expenses, partially offset by a higher provision for doubtful accounts, higher professional fees, rent related to new offices, and the impact of market fluctuations on an unfunded equity-linked retirement plan.
Adjusted OIBDA of $116.9 million decreased $6.3 million, or 5.1%, compared to the same prior-year period.
Segment Results
U.S. Media
Reported revenues of $428.7 million increased $0.7 million, or 0.2%, due primarily to higher billboard revenues. Billboard revenues increased 2.6% and Transit and other revenues decreased 8.6%. Organic revenues increased $0.7 million, or 0.2%.
Operating expenses increased $7.1 million, or 3.2%, primarily driven by higher variable billboard property lease expenses, the impact of new locations, including through acquisitions, and higher guaranteed minimum annual payments to the MTA, partially offset by a decline in non-MTA transit franchise costs. SG&A expenses increased $1.6 million, or 2.0%, primarily driven by a higher provision for doubtful accounts and higher professional fees, partially offset by lower compensation-related expenses.
Adjusted OIBDA of $120.2 million decreased $8.0 million, or 6.2%, compared to the same prior-year period.
Other
Reported revenues of $26.1 million increased $0.4 million, or 1.6%, due primarily to the impact of new billboards in the period, partially offset by the impact of foreign currency exchange rates and a decrease in average revenue per display (yield) as we have experienced decreases in overall demand for our services during the quarter. Organic revenues increased $1.0 million, or 4.0%.
Operating expenses increased $0.1 million, or 0.7%, due primarily to higher expenses in Canada, partially offset by the impact of foreign currency exchange rates. SG&A expenses decreased $0.2 million, or 3.4%, driven primarily by the impact of foreign currency exchange rates, partially offset by higher expenses in Canada.
Adjusted OIBDA of $6.3 million increased $0.5 million, or 8.6%, compared to the same prior-year period.

Corporate
Corporate costs, excluding stock-based compensation, decreased $1.2 million, or 11.1%, to $9.6 million, due primarily to lower compensation-related expenses, partially offset by the impact of market fluctuations on an equity-linked retirement plan offered by the Company to certain employees.
Impairment Charges
As previously disclosed, we recorded impairment charges in the second quarter of 2023 with respect to our U.S. Transit and Other reporting unit, primarily representing an impairment charge related to our MTA asset group. As a result of our continued expectation of negative aggregate cash flows related to our MTA asset group, we recorded an additional impairment charge of $12.1 million in the third quarter of 2023, representing additional MTA equipment deployment cost spending during the quarter.
Interest Expense
Net interest expense in the third quarter of 2023 was $40.2 million, including amortization of deferred financing costs of $1.6 million, as compared to $33.6 million in the same prior-year period, including amortization of deferred financing costs of $1.6 million. The increase was due primarily to higher interest rates compared to the same prior-year period and a higher average debt balance. The weighted average cost of debt at September 30, 2023 was 5.5% and at September 30, 2022 was 4.9%.
Income Taxes
The provision for income taxes was $1.4 million compared to a benefit for income taxes of $0.3 million in the same prior-year period due primarily to a valuation allowance against our U.S. TRS (as defined below). Cash paid for income taxes in the nine months ended September 30, 2023 was $5.9 million.
Net Income Attributable to OUTFRONT Media Inc.
Net income attributable to OUTFRONT Media Inc. decreased $23.8 million, or 58.3%, in the third quarter of 2023 compared to the same prior-year period. Diluted weighted average shares outstanding were 165.2 million for the third quarter of 2023 compared to 164.6 million for the same prior-year period. Net income attributable to OUTFRONT Media Inc. per common share for diluted earnings per weighted average share was $0.09 in the third quarter of 2023 compared to $0.23 in the same prior-year period.
FFO & AFFO
FFO attributable to OUTFRONT Media Inc. decreased $14.6 million, or 16.6%, in the third quarter of 2023, compared to the same prior-year period, due primarily to higher interest expense, lower Adjusted OIBDA and impairment of non-real estate assets. AFFO attributable to OUTFRONT Media Inc. decreased $10.8 million, or 12.5%, in the third quarter of 2023, compared to the same prior-year period, due primarily to higher interest expense and lower Adjusted OIBDA.
Cash Flow & Capital Expenditures
Net cash flow provided by operating activities decreased $25.6 million, or 14.6%, for the nine months ended September 30, 2023, compared to the same prior-year period. Total capital expenditures decreased $3.0 million, or 4.5%, to $63.6 million for the nine months ended September 30, 2023, compared to the same prior-year period.
Dividends
In the nine months ended September 30, 2023, we paid cash dividends of $155.4 million, including $148.8 million on our common stock and vested restricted share units granted to employees and $6.6 million on our Series A Convertible Perpetual Preferred Stock (the “Series A Preferred Stock”). We announced on November 2, 2023, that our board of directors has approved a quarterly cash dividend on our common stock of $0.30 per share payable on December 29, 2023, to stockholders of record at the close of business on December 1, 2023.
Balance Sheet and Liquidity
As of September 30, 2023, our liquidity position included unrestricted cash of $44.4 million, $493.5 million of availability under our $500.0 million revolving credit facility, net of $6.5 million of issued letters of credit against the letter of credit facility sublimit under the revolving credit facility, and no availability under our accounts receivable securitization facility. During the three months ended September 30, 2023, no shares of our common stock were sold under our at-the-market equity offering program, of which $232.5 million remains available. As of September 30, 2023, the maximum number of shares of our common stock that could be required to be issued on conversion of the outstanding shares of the Series A Preferred Stock was approximately 7.8 million shares. Total indebtedness as of September 30, 2023 was $2.8 billion, excluding $18.9 million of deferred financing costs, and includes a $600.0 million term loan, $2.1 billion of senior unsecured notes and $150.0 million of borrowings under our accounts receivable securitization facility.
Supplemental Materials
In addition to this press release, we have provided a supplemental investor presentation which can be viewed on our website, www.outfront.com.
About OUTFRONT Media Inc.
OUTFRONT leverages the power of technology, location and creativity to connect brands with consumers outside of their homes through one of the largest and most diverse sets of billboard, transit, and mobile assets in North America. Through its technology platform, OUTFRONT will fundamentally change the ways advertisers engage audiences on-the-go.


- Advertisement -