![]() Facing Up to TV as an Ad Medium:
Facing Up to TV as an Ad Medium:
Upon Closer Look
 Facing Up to TV as an Ad Medium:

by Kym Frank
President
Geopath
TV and Time Spent
I recently came across this interesting data set from eMarketer, that illustrates that by next year, time spent per day with a mobile device will surpass time spent with television among adults in the United States.

Three things surprised me when I read this report: First, that this hadn’t already happened years ago. Second, given the vast amount of ways that we can consume content today, average daily TV viewing had only fallen 40 minutes over the last 5 years, or by 15%. The third point is that American adults are still watching, on average, 230 minutes of television every day. That’s nearly four hours!
Of course, this seemed surprising to me because I can’t remember the last time I had a week where I could spend 27 hours watching television. I’m not even sure I spend 27 hours outside of the office and awake in the average week. As all good researchers know, you cannot rely upon a focus group of one. We also know – averages don’t tell the full story.
averages don’t tell the full story.
I was introduced to a company called Simulmedia while I was working at Optimedia a few years ago. They are an advanced TV provider that utilizes a variety of third and first party data sets to help advertisers and agencies reach more of their audience. They also can accurately measure the relationship between ad viewing and sales.
I reached out to my friends there to tap into the vast amounts of information they have about the fragmentation of television viewing – and to get some validation on my “hunch”: that there is massive variation in the amount of time that people are spending watching TV.
Sure enough, within a matter of minutes, they provided me with the following data. The chart illustrates time spent viewing traditional television in an average day with quintiles from low to high (lowest 20% of TV time spent, up to the highest 20%).
The lowest 20% of TV viewers spend, on average, 7 minutes watching TV a day, while the highest 20% spends 418 minutes. That’s 7 hours!
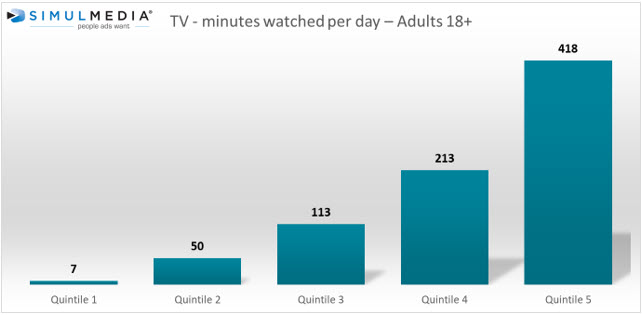
That means that the vast bulk of television advertising is being seen by the heaviest 20-40% of viewers and barely being seen at all by the lowest viewers. According to Simmons Research, the majority of those viewing the least are under the age of 34. Those viewing the most are over the age of 55.
the vast bulk of television advertising is being seen by the heaviest 20-40% of viewers and barely being seen at all by the lowest viewers
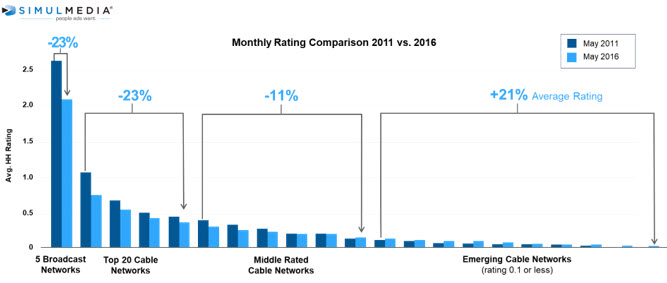
To make the issue even more complex, it’s grown increasingly challenging to reach viewers on channels with the highest reach.
Viewers are moving away from the top 5 broadcast networks as well as the top and middle rated cable networks, and moving toward niche emerging cable networks.
Every day out of home faces up to the juggernaut of television. TV viewing is highly variable and it is undoubtedly fragmenting – rapidly. The real growth, especially among the young, is in streaming sources that are not ad-supported. When it comes to live TV, advertisers can’t just look at averages. They need to go granular to get an accurate picture of what is happening.
Channel diversification is key to reaching audiences and maximizing ROI. The ARF recently conducted a study that found that increasing ad campaigns from one platform to two increased the return on investment by 19%, with each additional platform adding incremental lift.
And Out of Home should definitely be in the mix.
The channel will always have the advantage of immediacy and location. In a world of distraction and media fragmentation, #out of home is the precision-measured attention driver that deserves a closer look.
out of home is the precision-measured attention driver that deserves a closer look.

- Advertisement -